Most students first encounter CAPM as a formula. Some eventually understand the intuition behind it.
But then a deeper question appears.
Where does beta actually come from?
Because beta is not just a random number assigned to a stock. It emerges from a very specific mathematical idea.
And once you understand that idea, CAPM stops feeling like memorization. It starts feeling like a statistical model of how assets interact with markets.
Let’s Begin With a Simple Observation.
Suppose you observe three stocks.
- One rises strongly whenever the market rises.
- One barely reacts.
- One sometimes moves opposite to the market.
Clearly, these stocks do not carry the same kind of market risk. So finance needs a way to measure something very specific.
“How strongly does an asset move with the market?”
This question leads us to one of the most important ideas in finance, Covariance.
Covariance — The Mathematics of Moving Together
Covariance measures whether two things move together.
If:
- market rises → stock rises,
- market falls → stock falls,
then covariance is positive. The stock moves with the market. If the stock moves against the market, covariance becomes negative.
If movements appear unrelated, covariance is close to zero.
Why Covariance Matters So Much
At this point, something profound becomes clear. CAPM does not really care about how volatile a stock is by itself. It cares about how the stock behaves relative to the market.
This is one of the deepest conceptual shifts in finance.
Because market risk is fundamentally about co-movement.
But Covariance Alone Is Not Enough
Suppose:
- one market is extremely volatile,
- another market is relatively stable.
The same covariance value may imply different levels of sensitivity.
So finance normalizes covariance, and that gives us beta.
The Beta Formula
At first glance, this looks technical.
But the intuition underneath is beautiful.
Understanding the Numerator
The numerator measures how strongly the stock moves with the market.
Higher covariance means:
- stronger market linkage,
- greater systematic risk.
Denominator measures how volatile the market itself is.
So beta essentially asks “Relative to total market volatility, how sensitive is this stock?”
A Deep Insight
Beta is not just volatility. It is relative market sensitivity.
This is why:
- a highly volatile stock may still have low beta,
- while a relatively stable stock may sometimes have high beta.
The key is not isolated movement. The key is market-linked movement.
Now let us think this way.
Suppose a company has:
- unstable cash flows,
- uncertain profits,
- weak management,
but very little connection with market movements, should beta necessarily be high?
Not always.
And this reveals something subtle. CAPM measures systematic risk, not total uncertainty.
Covariance vs Correlation
At this point, another question appears. If covariance already measures co-movement, why do we need correlation?
Because covariance depends on scale.
Large numbers can produce large covariance even when relationships are weak.
Correlation standardizes covariance into a cleaner relationship measure between:
- -1 and +1.
This makes comparison easier.
Correlation Interpretation
| Correlation | Meaning |
| +1 | Perfect positive movement |
| 0 | No relationship |
| -1 | Perfect opposite movement |
But Notice Something Important
CAPM uses covariance, not correlation. Why?
Because CAPM ultimately cares about:
- magnitude,
- sensitivity,
- and contribution to overall market risk.
Beta and Regression — The Statistical Interpretation
Now let’s go one step deeper.
Suppose we plot:
- market returns on the X-axis,
- stock returns on the Y-axis.
Each point represents one observation. Over time, we get a cloud of points.
Now imagine drawing the “best-fit” straight line through them.
The slope of that line is beta. This means beta is not manually assigned, but statistically estimated.
And this estimation process is called regression analysis.
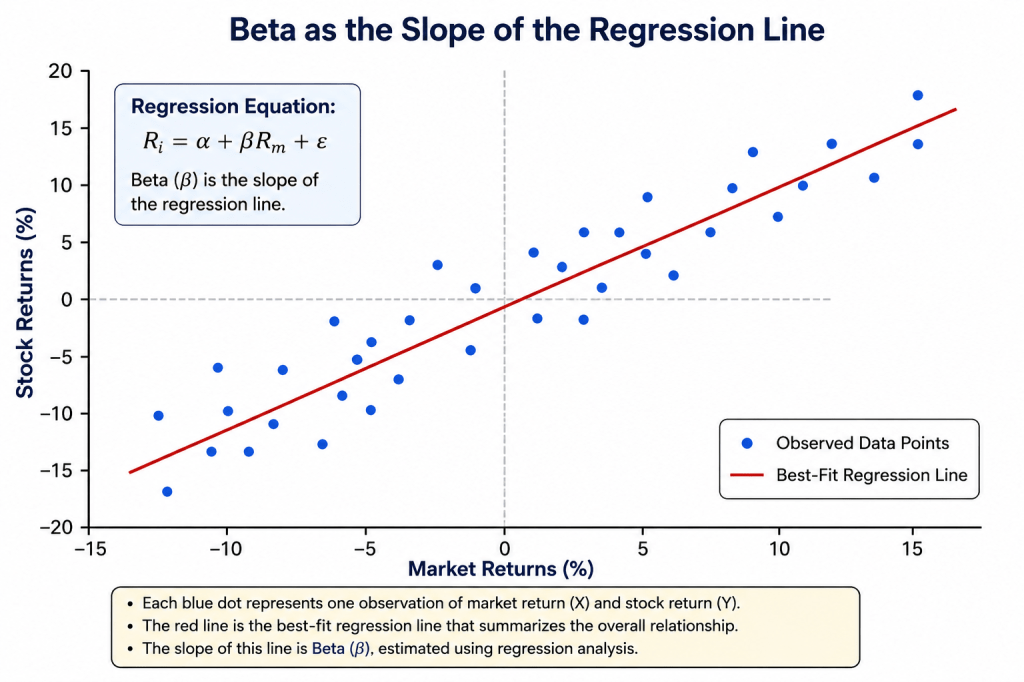
The Hidden Meaning of Beta
Now beta becomes much more intuitive.
If the line is steep:
- stock reacts strongly to market changes,
- beta is high.
If the line is flatter:
- stock reacts weakly,
- beta is low.
R² — The Forgotten Statistic
Now another important idea appears.
Even if beta is estimated using regression, how reliable is that relationship?
This is where R2 becomes important.
What Does R² Mean?
R² is the coefficient of determination statistically. It measures how much of the stock’s movement is explained by market movement.
Example:
Suppose R² = 80%
This means:
- around 80% of stock movement is linked to market movement,
- while the remaining 20% comes from company-specific or unexplained factors outside market movement.
Why This Matters
Two stocks may have:
- identical beta,
- but very different R².
One may move consistently with the market.
The other may move unpredictably.
So beta alone does not tell the entire story.
Residual Risk — The Part CAPM Cannot Fully Explain
Even after regression, some movement remains unexplained.
This leftover component is called residual risk or idiosyncratic risk.
This beautifully connects back to diversification.
Because:
- market-related movement becomes systematic risk,
- unexplained movement becomes diversifiable risk.
CAPM Is Quietly a Linear Model
At this point, something elegant appears. CAPM assumes risk and return have a linear relationship.
Why?
Because each additional unit of market risk, earns proportional additional return.
This creates the Security Market Line. A straight line.
The Slope of the Security Market Line
Remember E(R)=Rf+β(E(Rm)-Rf)
Here (E(Rm)-Rf) is the slope of the line.
It tells us how much extra return investors demand for each additional unit of market risk.
The Calculus Insight
Now let’s connect CAPM to calculus. Suppose expected return is a function of beta.
Then,
asks “How much does expected return change if beta changes slightly?”
Differentiate CAPM equation with respect to beta.
It is E(Rm)−Rf
This is powerful.
It means the marginal increase in expected return per additional unit of risk is constant.
That is exactly why the Security Market Line is straight.
Differentiate Again
Meaning, the relationship has no curvature, no acceleration, no changing slope.
Pure linearity.
Why This Matters
The second derivative being zero tells us CAPM assumes markets reward risk at a constant rate.
Reality may not always behave this cleanly, and this becomes one reason advanced finance models move beyond CAPM.
Beta as a Geometric Idea
There is another beautiful way to think about beta. Imagine every asset as a direction of movement in financial space. Some assets move closely with the market direction, others move independently.
Beta measures how aligned an asset is with overall market movement.
This is one reason CAPM eventually connects deeply with:
- portfolio geometry,
- optimization,
- and vector mathematics.
A Beautiful Realization
At the beginning, CAPM looked like one simple formula.
Now we realize it quietly contains:
- statistics,
- covariance structure,
- regression,
- geometry,
- and calculus.
And yet the central idea remains surprisingly simple:
Investors should only be rewarded for unavoidable market risk.
The mathematics merely formalizes that intuition.
Final Thought
Most students memorize beta, very few ask where beta comes from.
Once you understand the mathematics underneath, CAPM stops feeling like a formula.
It starts feeling like a statistical model describing how assets interact with markets.
One Line to Remember
Beta is not just a number. It is the statistical fingerprint of how an asset reacts to the market.
What Next?
Now that we understand the hidden mathematics behind CAPM, we can go even deeper.
Because underneath CAPM lies an even bigger mathematical framework:
- diversification,
- portfolio optimization,
- efficient frontiers,
- and the geometry of portfolio construction itself.

Leave a comment