Let’s begin with a simple situation. Imagine this. You walk into a room and someone offers you two choices:
Option A: “I’ll give you a fixed 10% return. Guaranteed.”
Option B: “Your return could be 5%, 15%, or even -5%.”
Which one feels riskier?
Obviously option B.
Not because it always gives lower returns, but because you don’t know what you’ll get.
So, what exactly is risk?
At its core, risk is uncertainty of returns.
That’s it. No complicated definitions. No jargon.
If risk means uncertainty, why would anyone choose the risky option?
Because higher risk → higher expected return
If both safe and risky investments gave the same return, no one would ever choose risk.
This is the first building block of finance.
But here’s where it gets interesting. Not all risk is treated equally.
This is where most students get confused.
Let’s break total risk into two parts:
Total Risk = Unsystematic Risk + Systematic Risk
Unsystematic Risk — This is company-specific risk, the avoidable one
- A CEO resigns
- A product fails
- A factory shuts down
If you invest in only one company, this risk affects you directly.
But what if you invest in 20 different companies?
One company may fail, but others may perform well.
Unsystematic risk can be reduced with diversification.
Systematic Risk — The Unavoidable One
Now think bigger.
- Market crashes
- Interest rates rise
- Economy slows down
Now almost everything is affected.
No matter how many stocks you hold, you cannot escape it.
The Idea That Changed Everything
Now think about this carefully.
If a risk can be avoided, should the market reward you for taking it?
Probably not. Because, you had the option to avoid it.
So the market says, “I will only reward you for the risk you cannot avoid.”
The Core Insight
Only systematic risk is rewarded.
This single idea is the foundation of the Capital Asset Pricing Model (CAPM).
We now know that systematic risk matters and unsystematic does not. But we need a number to measure systematic risk.
Here enters beta (β).
Beta tells us how much a stock moves when the market moves.
It measures market-related risk.
- β = 1 → Stock moves exactly like the market
- β > 1 → Stock is more volatile than the market
- β < 1 → Stock is less volatile than the market
If the market rises by 10%:
- A stock that rises by 15% has high beta
- A stock that rises by 5% has low beta
If the market falls:
- High beta stocks fall more
- Low beta stocks fall less
Beta captures how sensitive a stock is to market movements.
Now Let’s Build CAPM step by step instead of memorizing a formula.
Every return has two parts:
- Base Return (what you earn without risk) → Rf
- Extra Return (for taking risk) → Risk Premium
We already know:
- Risk is measured by beta
- Higher beta means higher risk
So naturally:
Higher beta → Higher expected return
The CAPM Equation
Putting everything together:
E(R)=Rf+β(E(Rm)−Rf)
There is no need to memorize this since we already understand it.
- Rf = base return
- β = how much risk you are taking
- (Rm − Rf) = reward per unit of risk
CAPM simply combines these ideas.
Visualizing CAPM — Security Market Line
Let’s visualize this relationship.
Imagine a graph:
- X-axis = Beta (risk)
- Y-axis = Expected return
At:
- β = 0 → return = Rf
- β = 1 → return = Rm
Join these points and you get a straight line.
This line is called the Security Market Line (SML).
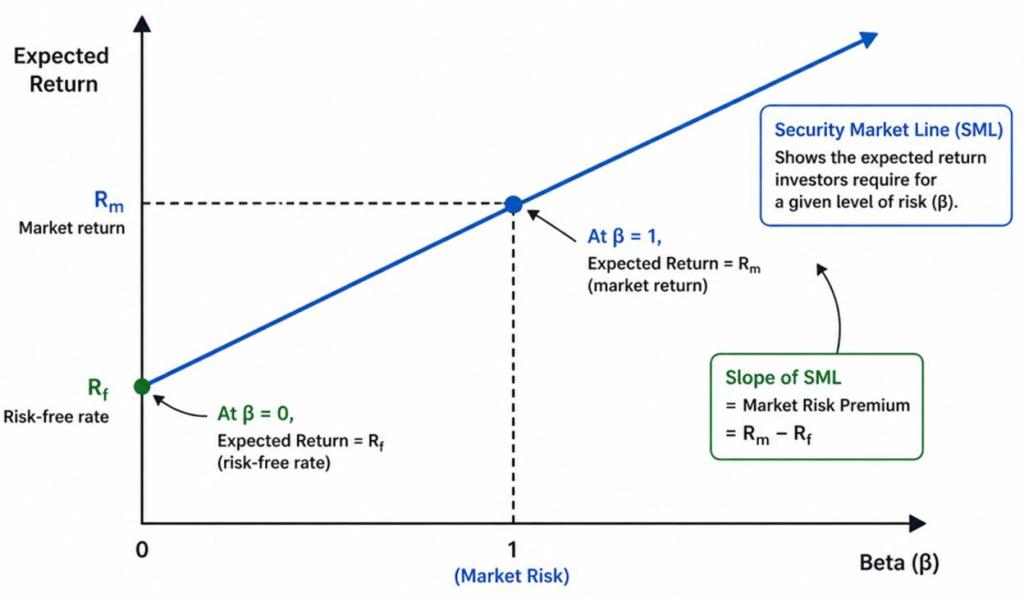
What Does the Slope Represent?
The slope of this line is:
Market risk premium = (Rm − Rf)
It shows how much extra return investors demand for each unit of risk.
A Powerful Insight: Mispricing
What if a stock does not lie on this line?
If it lies above the line:
- It gives more return than required
- It is undervalued
If it lies below the line:
- It gives less return than required
- It is overvalued
Final Summary
- Risk = uncertainty
- Higher risk leads to higher expected return
- Only systematic risk is rewarded
- Beta measures market risk
- CAPM links risk and return
- SML shows this relationship visually
One Line to Remember
CAPM tells you how much return you should expect for a given level of market risk.
What Next?
Now that you understand CAPM conceptually, the next step is applying it.
In the next blog, we’ll solve CAPM numericals step by step—and you’ll see how simple it becomes once the logic is clear.

Leave a comment